Three months of fire on Earth, seen from space
NASA satellites detected 5.6 million vegetation fires between late July and mid-October. 50% of them burned in Africa, most of them set on purpose.

A different view of our planet
SpatialStat turns satellite images and open data into clear maps, visual investigations and stories about how our planet is changing.
Curiosity, grounded in evidence. Every map has a source.
The latest investigations
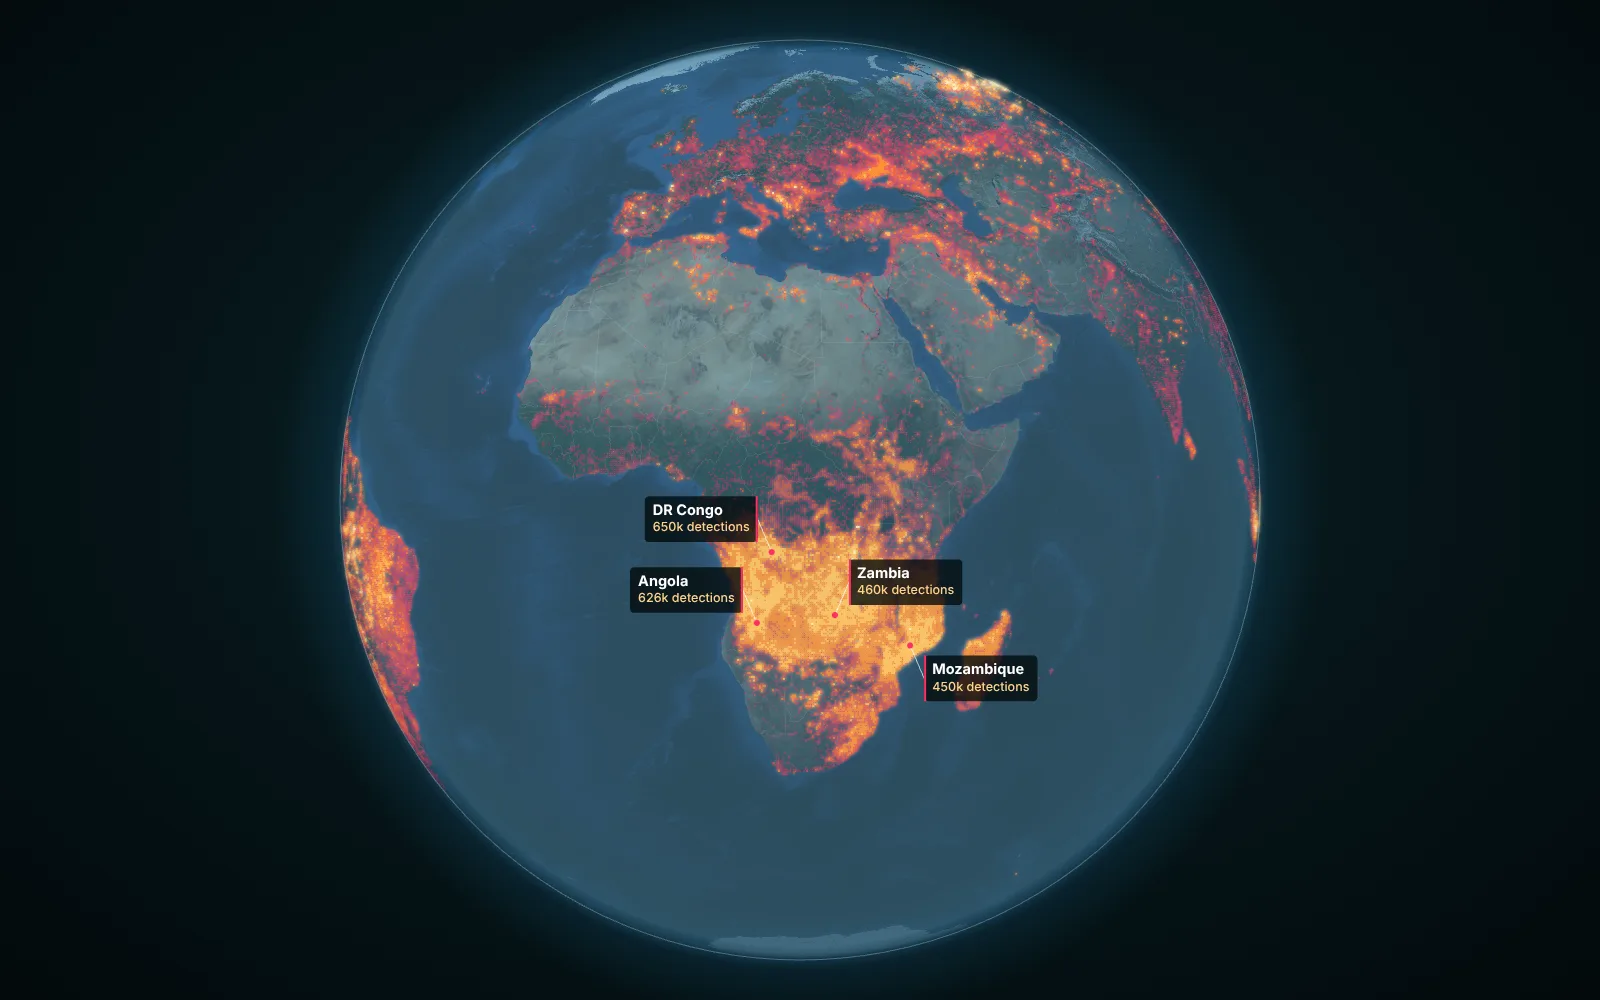
NASA satellites detected 5.6 million vegetation fires between late July and mid-October. 50% of them burned in Africa, most of them set on purpose.
Mapping one of the largest human-made environmental disasters, decade by decade, with satellite images and the stories of the people who live on its former shore.
To reach the ocean from Uzbekistan or Liechtenstein, you have to cross at least two borders. Here is what that looks like on a map.
The SpatialStat atlas
Start with a place, follow a pattern, ask a better question. Each point opens a research question we are working on.
Select a point on the map to read its research question.
Follow your curiosity
The Earth does not fit into one discipline. Neither should the stories we tell about it.
Rivers, lakes, glaciers, irrigation and the systems connecting them.
Climate scienceHeat, drought, extremes and the long patterns behind the weather.
Earth observationWhat remote sensing reveals about a changing surface.
Spatial analysisSpatial statistics, hidden relationships and the geography of change.
Trust the process
We show our sources, explain our methods and make uncertainty visible. Every map should help you understand not just what the data says, but how we know.
Our approachField notes
Field notes: one map a week, the story behind it and the data used to make it. Free.