
Deep Dive
The Aral Sea, 60 years later
Mapping one of the largest human-made environmental disasters, decade by decade, with satellite images and the stories of the people who live on its former shore.
2 November 2026, 12 min read
Introduction
Start with one striking image or fact, then say what this piece will show.
A sea that shrank
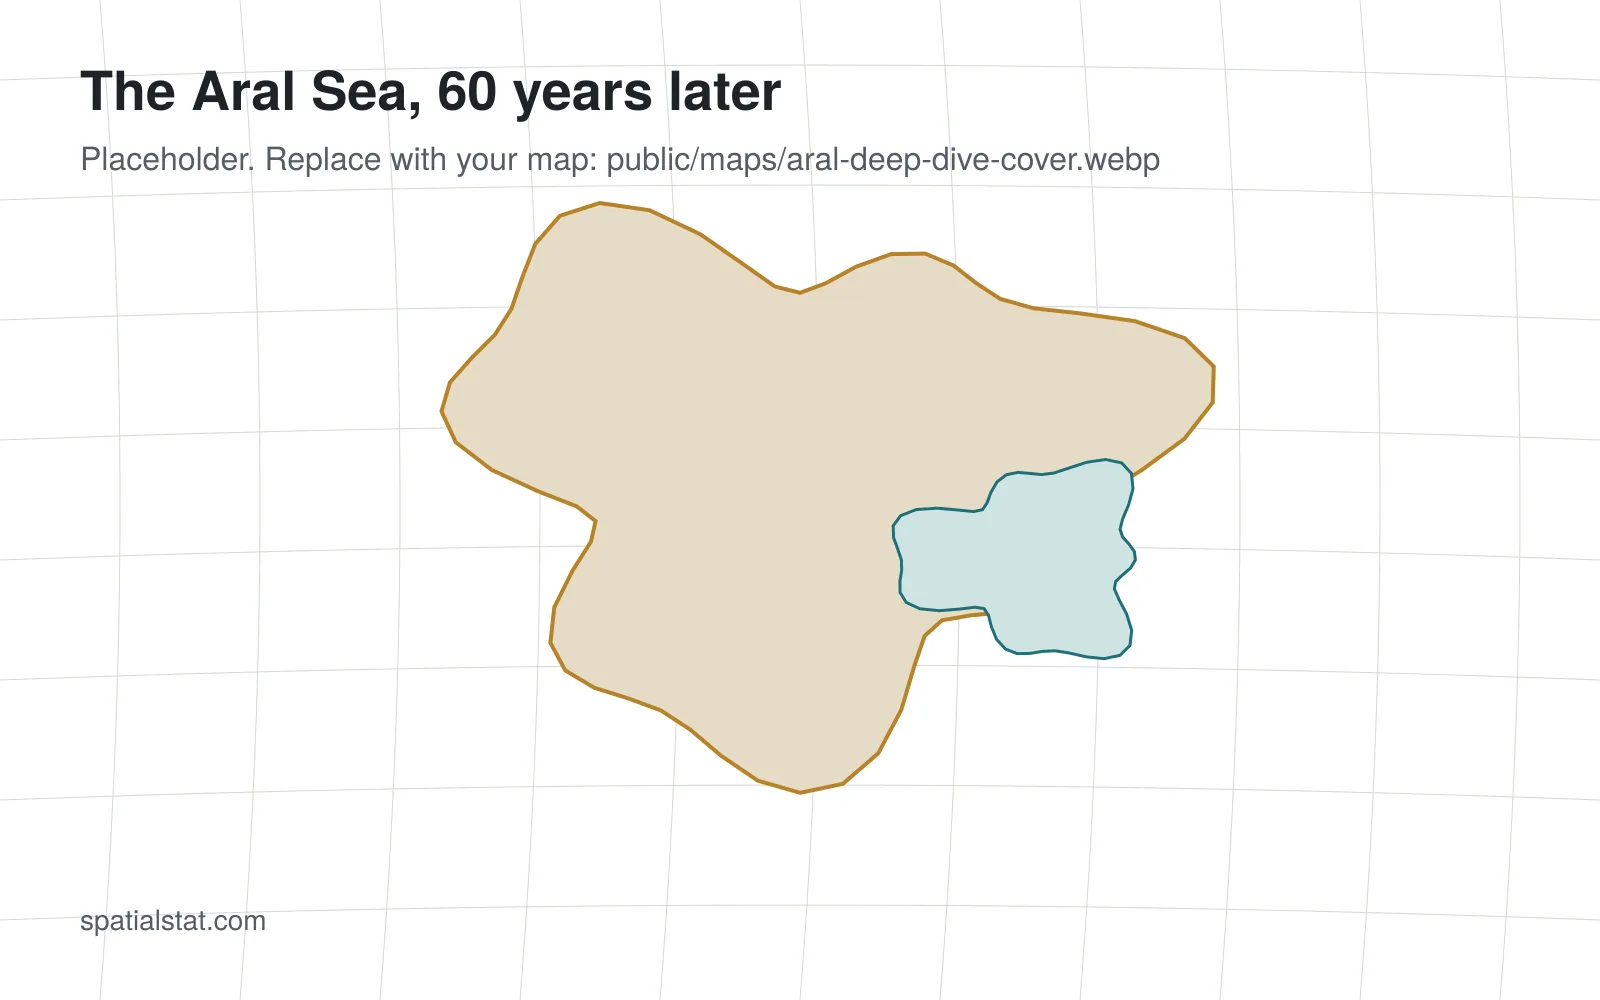
Shorelines from the 1960s to today, traced from Landsat images. Embed an interactive map here (Datawrapper, Felt or MapLibre) with a static image as a fallback.
Where the water went
The rivers, the irrigation canals and the cotton fields. A flow map works well here.
Life on the former shore
Towns, fishing ports and health effects. Use data from statistics agencies and published studies.
The northern recovery
What changed after the Kokaral dam, and what the satellite record shows.
Data and methods
List every dataset, its licence, the processing steps and the limits of the analysis.